Images of the brain
Using machines such as magnetic resonance image scanners, we can see into our brains. The images provide considerable help in detecting various disease-related changes such as tumours or constrictions in blood vessels. These images can also show how the brain works and answer questions such as: where is there activity and which parts are connected? But, does this mean that we can see thoughts and feelings?
Producing images of the brain became possible in the 1970s. Initially, computed tomography was used in combination with X-rays to create digital cross sections of the body. Magnetic resonance tomography was introduced in the 1980s. The first experimental magnetic resonance image (MRI) scanner in Sweden was built at Lund University in 1983. Its magnetic field strength was 0.07 tesla, a hundred times weaker than Sweden’s current strongest MRI scanner, which was installed in Lund in 2015 and has a magnetic field strength of seven tesla (7T).
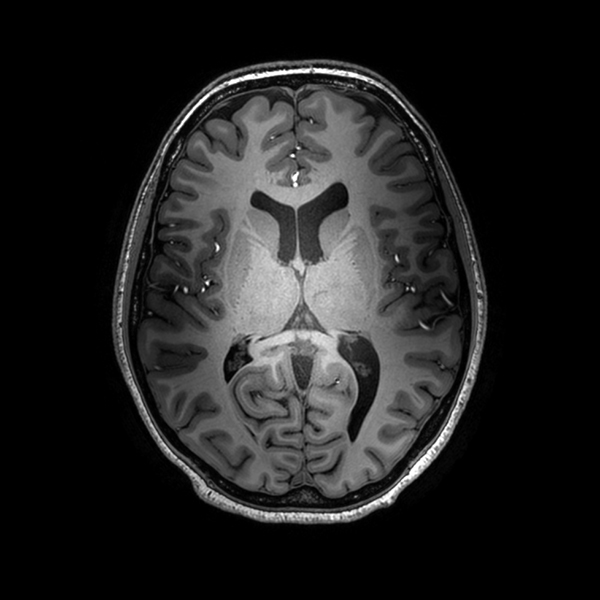
The image shows grey and white matter. The outer surface of the brain, the cortex of the brain, consists of gray matter containing several billion nerve cells that are in contact with each other through their long axons. Many thick axons are surrounded by glial cells, which contain a fatty white substance, myelin. These axons form the white brain matter. Image: Karin Markenroth Bloch, Lund University Bioimaging Center.
“At the start, computed tomography and MRI techniques were mostly used to depict the brain’s normal appearance and structure, as well as the deviations that arise over the course of a disease”, relates neuroradiologist Isabella Björkman-Burtscher, who heads the medical side of the 7T project. “In parallel with the technique’s rapid entry into clinical routines, research has also flourished in the area, with a particular focus on gaining higher definition and mapping the brain’s functions.”
One example is so-called functional MRI (fMRI) in which the MRI scanner measures the parts of the brain that are activated by conscious and unconscious impressions or by actions that are carried out such as moving a part of the body, talking, listening, or looking at something.
“The blood flow increases in the active parts of the brain, as more oxygen is needed there”, says physicist Karin Markenroth Bloch, who is the coordinator at the 7T facility. “The functional MR technique is sensitive to differences between and oxygen-rich and oxygen-poor blood in the small blood vessels that convey oxygen to the nerve cells.”
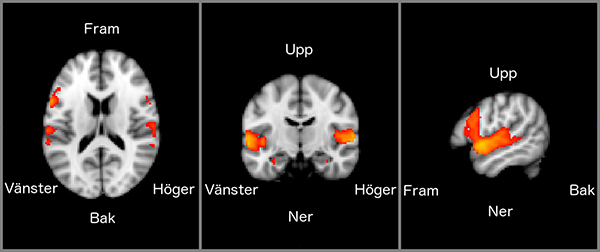
The image shows the areas that are active when people listen to spoken sentences while they are in the MRI scanner. Activity is seen in areas of the upper temporal lobe (just above the ear) which, somewhat simplified, take care of sound signals in general, and which also have areas that respond specifically to language sounds. In addition, we see areas beyond the eye in something called Broca’s area in the rear/lower frontal lobe that is related to the processing of grammar. Image: Mikael Novén, PhD student in neurolinguistics at the Centre for Language and Literature, studies how we use Swedish language prosody (language melody) to help our understanding of the grammatical structure of the sentence. He also studies how this is learned by people who learn Swedish as a foreign language.
Statistical analysis and digital image processing are involved in producing a 3-D map of the activity, which can be used to interpret where various functions are located in the brain. The new, stronger 7T MR image scanner means that functional MR studies can be enhanced; analyses and results become more reliable and the number of test subjects can therefore be reduced.
“We also use other MR techniques through which we can map the nerves’ pathway system by measuring how the water molecules move in the tissues”, states Karin Markenroth Bloch. “Using this approach, we see how different parts of the brain are connected – which ‘cable goes where’. This can be used, for example, in studies on learning, and to study how the brain works when it’s healthy.”
![]()
The image shows bundles of nerve fibers in a human brain and is taken with a MRI scanner with so called diffusion technology (a technique where you register the water molecules movement in the fibers). Using the computer, the brain’s nerve fibers can then be reconstructed into three dimensions. Photo: Karin Markenroth Bloch, Lund University Bioimaging Center.
“By using a number of different techniques, we can subsequently build models that show how the brain functions normally and changes due to different diseases”, adds Isabella Björkman-Burtscher.
“But”, continues Isabella Björkman-Burtscher, “MR images do not enable us to see what a person is thinking or feeling.”
Text: Pia Romare
The video shows MRI angiography where the arteries of the brain are made white. The blood flow in the vessels is used to generate image contrast. 7T technology, with its high resolution, allows, among other things, that even small vessels on the periphery of the brain can be produced in a better way than with e.g. clinical field strengths. Video: Lund University Bioimaging Center.
Facts
-
Lund University Bioimaging Center (LBIC)
-
At Lund University Bioimaging Center our mission is to combine knowledge in the fields of medical physics, preclinical and clinical medicine, chemistry, technology and applied mathematics in order to provide and develop imaging methods for the advanced study of human morphology, cellular metabolism and physiological function in health and disease.
Read more at the LBIC website
Share this article:
![]()
![]()
![]()
![]()